Snack Checker — what's actually in the packet
Information only, not medical advice. Data comes from Open Food Facts, a crowd-sourced database, so values can be wrong or missing — always read the pack. Your care team sets your targets.
Most people read the front of the packet. The sodium is on the back, in a column most of us were never taught to read. This page takes a barcode and puts the three numbers that matter to blood pressure, blood sugar and kidneys — sodium, sugar and salt — in one place, in plain numbers, without a login or an email address.
Why per 100 g. The back of a pack might say 6% of your daily sodium. Six percent of what? Per 100 g gives you one yardstick for every product on the shelf, so a bag of chips and a can of soup can be compared without a calculator. It is not the amount you will eat — it is the amount you can compare.
Why the serving size lies. A “serving” is a number chosen by the company that sells the product. One bag of chips can be listed as two or three servings, so the sodium per serving looks smaller than the sodium in the bag you just finished. Per 100 g cannot be re-scoped that way. When a serving size exists on the pack, this page shows it as well — but the 100 g line is the one to trust for comparisons.
Salt is sodium, times 2.5. If a label gives salt and you want sodium, divide by 2.5. If it gives sodium and you want salt, multiply by 2.5. The table below shows both, so you never have to do it in your head. This is the single most useful conversion on any nutrition label, and it is why two products with “the same” sodium can look wildly different once one of them is quoted as salt.
Three lenses, one barcode. The switch at the top of the checker changes what gets the headline. Sodium is the one most people need for blood pressure and kidneys; sugar matters for blood glucose; carbohydrate is the bigger picture that sugar sits inside. The same scanned packet answers all three, and the table below carries all three columns.
What the colours mean. The traffic lights use the UK Food Standards Agency front-of-pack thresholds — a public labelling standard, not a personal target. Salt above 1.5 g per 100 g is red, 0.3 to 1.5 g is amber, below 0.3 g is green; sugar above 22.5 g per 100 g is red, 5 to 22.5 g amber, below 5 g green. Carbs get no colour, because no official front-of-pack threshold exists for total carbohydrate — the number is the point.
When a number is missing. A crowd-sourced database is not a label. If a value is not listed, this page says “not listed” and never prints a zero — a zero would be a claim about a real product, and it would often be wrong. The pack in your hand always wins.
Where the data comes from. Product data comes from Open Food Facts, a free, crowd-sourced database that anyone can correct. The table below is a fixed snapshot with a source link on every row, so you can check the number yourself.
Contains data from Open Food Facts, available under the Open Database License.
Information only, not medical advice. Your care team sets your targets.
Checking sodium: the number the packet hides, plus the salt it equals.
Traffic lights use the UK Food Standards Agency front-of-pack thresholds — a public labelling standard, not a personal target: salt above 1.5 g per 100 g is red, 0.3–1.5 g amber, below 0.3 g green; sugar above 22.5 g red, 5–22.5 g amber, below 5 g green.
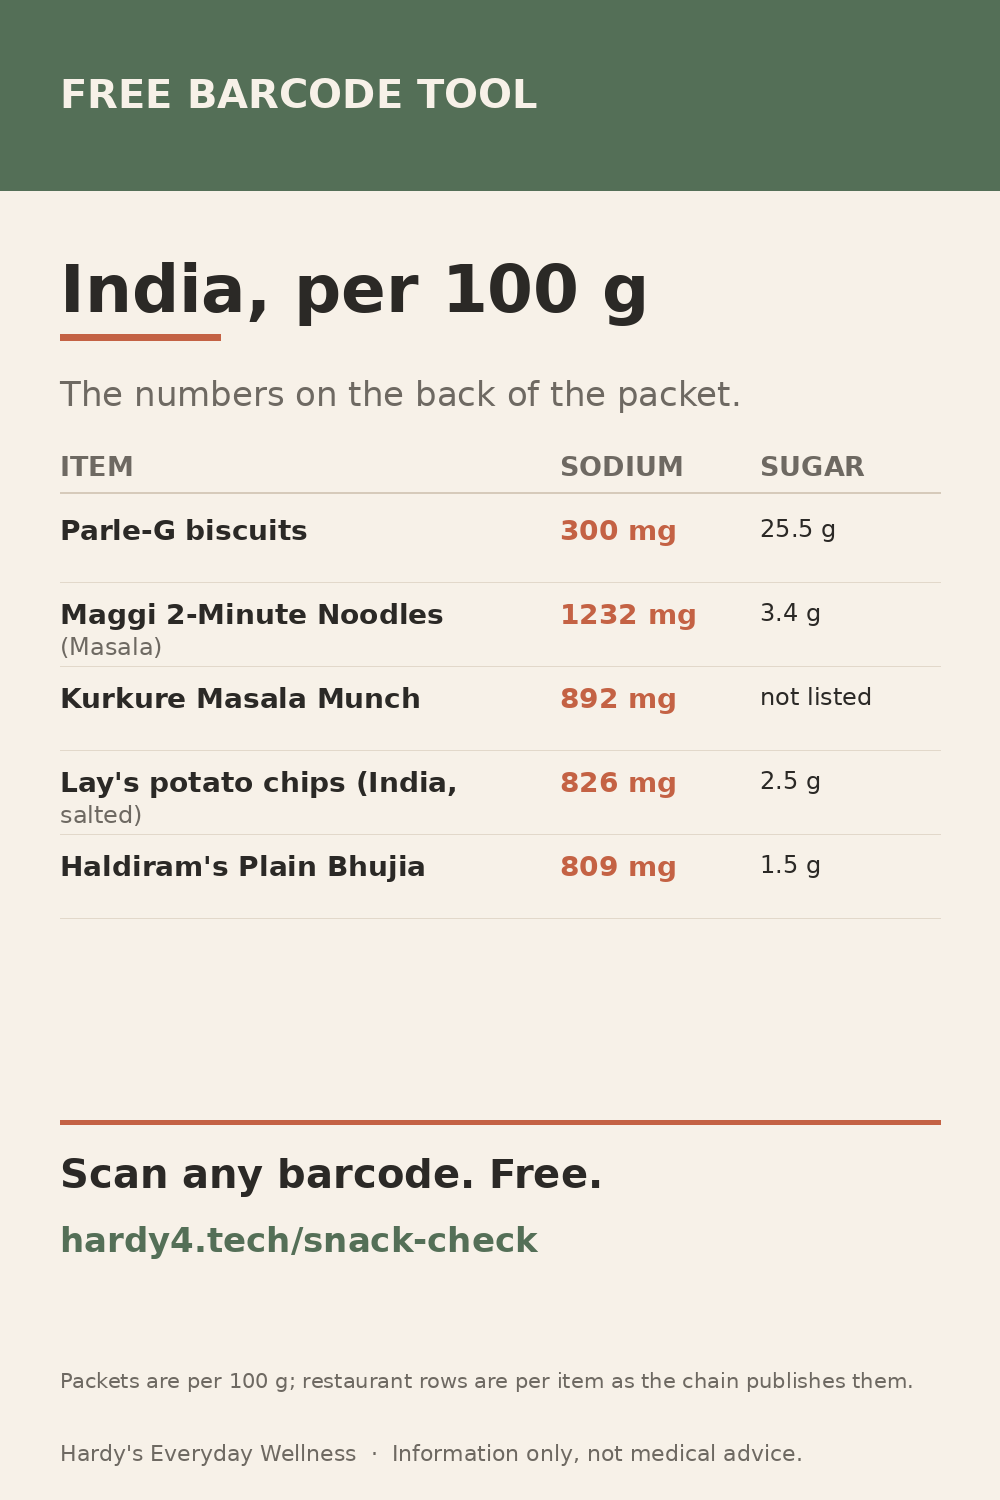
The table — 24 packets, three markets, read on 2026-11-01
This is the same data as a plain table, so it works with JavaScript off and so a dietitian, blogger or reporter can cite a row. Restaurant items are per item as the chain publishes them; packaged items are per 100 g. Salt is calculated from sodium as salt = sodium × 2.5.
| Item | Market | Basis | Sodium | Sugar | Carbs | Salt | Source |
|---|---|---|---|---|---|---|---|
| Parle-G biscuits | India | per 100 g | 300 mg | 25.5 g | 78.4 g | 0.75 g | Open Food Facts |
| Maggi 2-Minute Noodles (Masala) | India | per 100 g | 1232 mg | 3.4 g | 63.57 g | 3.08 g | Open Food Facts |
| Kurkure Masala Munch | India | per 100 g | 892 mg | not listed | 55.2 g | 2.23 g | Open Food Facts |
| Lay's potato chips (India, salted) | India | per 100 g | 826 mg | 2.5 g | 53.4 g | 2.06 g | Open Food Facts |
| Haldiram's Plain Bhujia | India | per 100 g | 809 mg | 1.5 g | not listed | 2.02 g | FatSecret India |
| Britannia Good Day Cashew Cookies | India | per 100 g | 218 mg | 22 g | 65 g | 0.55 g | Open Food Facts |
| Cadbury Bournvita | India | per 100 g | 175 mg | 46 g | 86 g | 0.44 g | Open Food Facts |
| Kissan Fresh Tomato Ketchup | India | per 100 g | 680 mg | 24 g | not listed | 1.7 g | Unilever Food Solutions India |
| Tim Hortons Sausage Farmer's Wrap | Canada | per wrap | 940 mg | 4 g | 50 g | 2.35 g | Tim Hortons Canada nutrition guide, July 2026 |
| Tim Hortons Chili (Regular) | Canada | per bowl | 910 mg | 7 g | 22 g | 2.27 g | Tim Hortons Canada nutrition guide, July 2026 |
| McDonald's Quarter Pounder with Cheese | Canada | per burger | 1050 mg | 10 g | 41 g | 2.62 g | McDonald's Canada, published nutrition summary |
| Kraft Dinner Original | Canada | per 100 g | 659 mg | 12.94 g | 71.76 g | 1.65 g | Open Food Facts |
| Maple Leaf Thin Sliced Bologna | Canada | per 100 g | 810 mg | not listed | 4.76 g | 2.02 g | Open Food Facts |
| Campbell's Condensed Light Tomato Soup | Canada | per 100 g | 384 mg | 8 g | 12.8 g | 0.96 g | Open Food Facts |
| Campbell's Chicken Noodle Soup | Canada | per 100 g | 624 mg | 0.8 g | 6.4 g | 1.56 g | Open Food Facts |
| Subway 6-inch Turkey Breast | Canada | per 100 g | 158 mg | 1.37 g | not listed | 0.4 g | Open Food Facts |
| McDonald's Big Mac | United States | per burger | 1060 mg | 7 g | 45 g | 2.65 g | McDonald's USA, published nutrition summary |
| Subway 6-inch Italian BMT | United States | per 100 g | 247 mg | 1.77 g | not listed | 0.62 g | Open Food Facts |
| Lay's Classic Potato Chips | United States | per 100 g | 495 mg | 3.53 g | 53 g | 1.24 g | Open Food Facts |
| Campbell's Condensed Chicken Noodle Soup | United States | per 100 g | 618 mg | not listed | 5.56 g | 1.54 g | Open Food Facts |
| Kraft Macaroni & Cheese (Original) | United States | per 100 g | 845 mg | 8.62 g | 68.97 g | 2.11 g | Open Food Facts |
| Oscar Mayer Turkey Hot Dogs | United States | per 100 g | 1152 mg | 2.22 g | 4.44 g | 2.88 g | Open Food Facts |
| Doritos Nacho Cheese | United States | per 100 g | 607 mg | not listed | 60.71 g | 1.52 g | Open Food Facts |
| Heinz Tomato Ketchup | United States | per 100 g | 941 mg | 23.5 g | 25.8 g | 2.35 g | USDA FoodData Central |
Contains data from Open Food Facts, available under the Open Database License. The table above is a derivative database published under the same licence at /data/snacks.json.
We count page visits and how many lookups happen. We do not know who you are and we store nothing about you. No account, no email, no cookies for tracking.